A documented investigation into the global atmospheric signature of the 1883 eruption, the geometry behind seven recorded passages, and the difference between a pressure wave and a tsunami.
A line moved on a machine thousands of kilometres away
On 27 August 1883, instruments far from the Sunda Strait registered an odd disturbance. At meteorological observatories in Europe, ink traces on barographs—the machines that continuously recorded atmospheric pressure—rose and fell in patterns that did not belong to an ordinary local weather front. The event that had disturbed them was a volcanic explosion at Krakatau, between Java and Sumatra. The people near the island faced something far worse than a curious squiggle: devastating tsunamis, ash and a collapsing volcanic landscape. But the distant pressure traces offered a second story, one that the people experiencing the disaster could not have seen. The atmosphere itself had become a messenger. A disturbance from one point on Earth had travelled across oceans, passed observatories, converged near the opposite side of the globe and returned. How could air, which seems so yielding when we move through it, preserve a coherent signal over planetary distances? The answer lies in the peculiar way an atmosphere can carry energy, and in an international network of observers who learned to read a catastrophe from its faintest distant signature.
The disaster and the danger of telling it backward
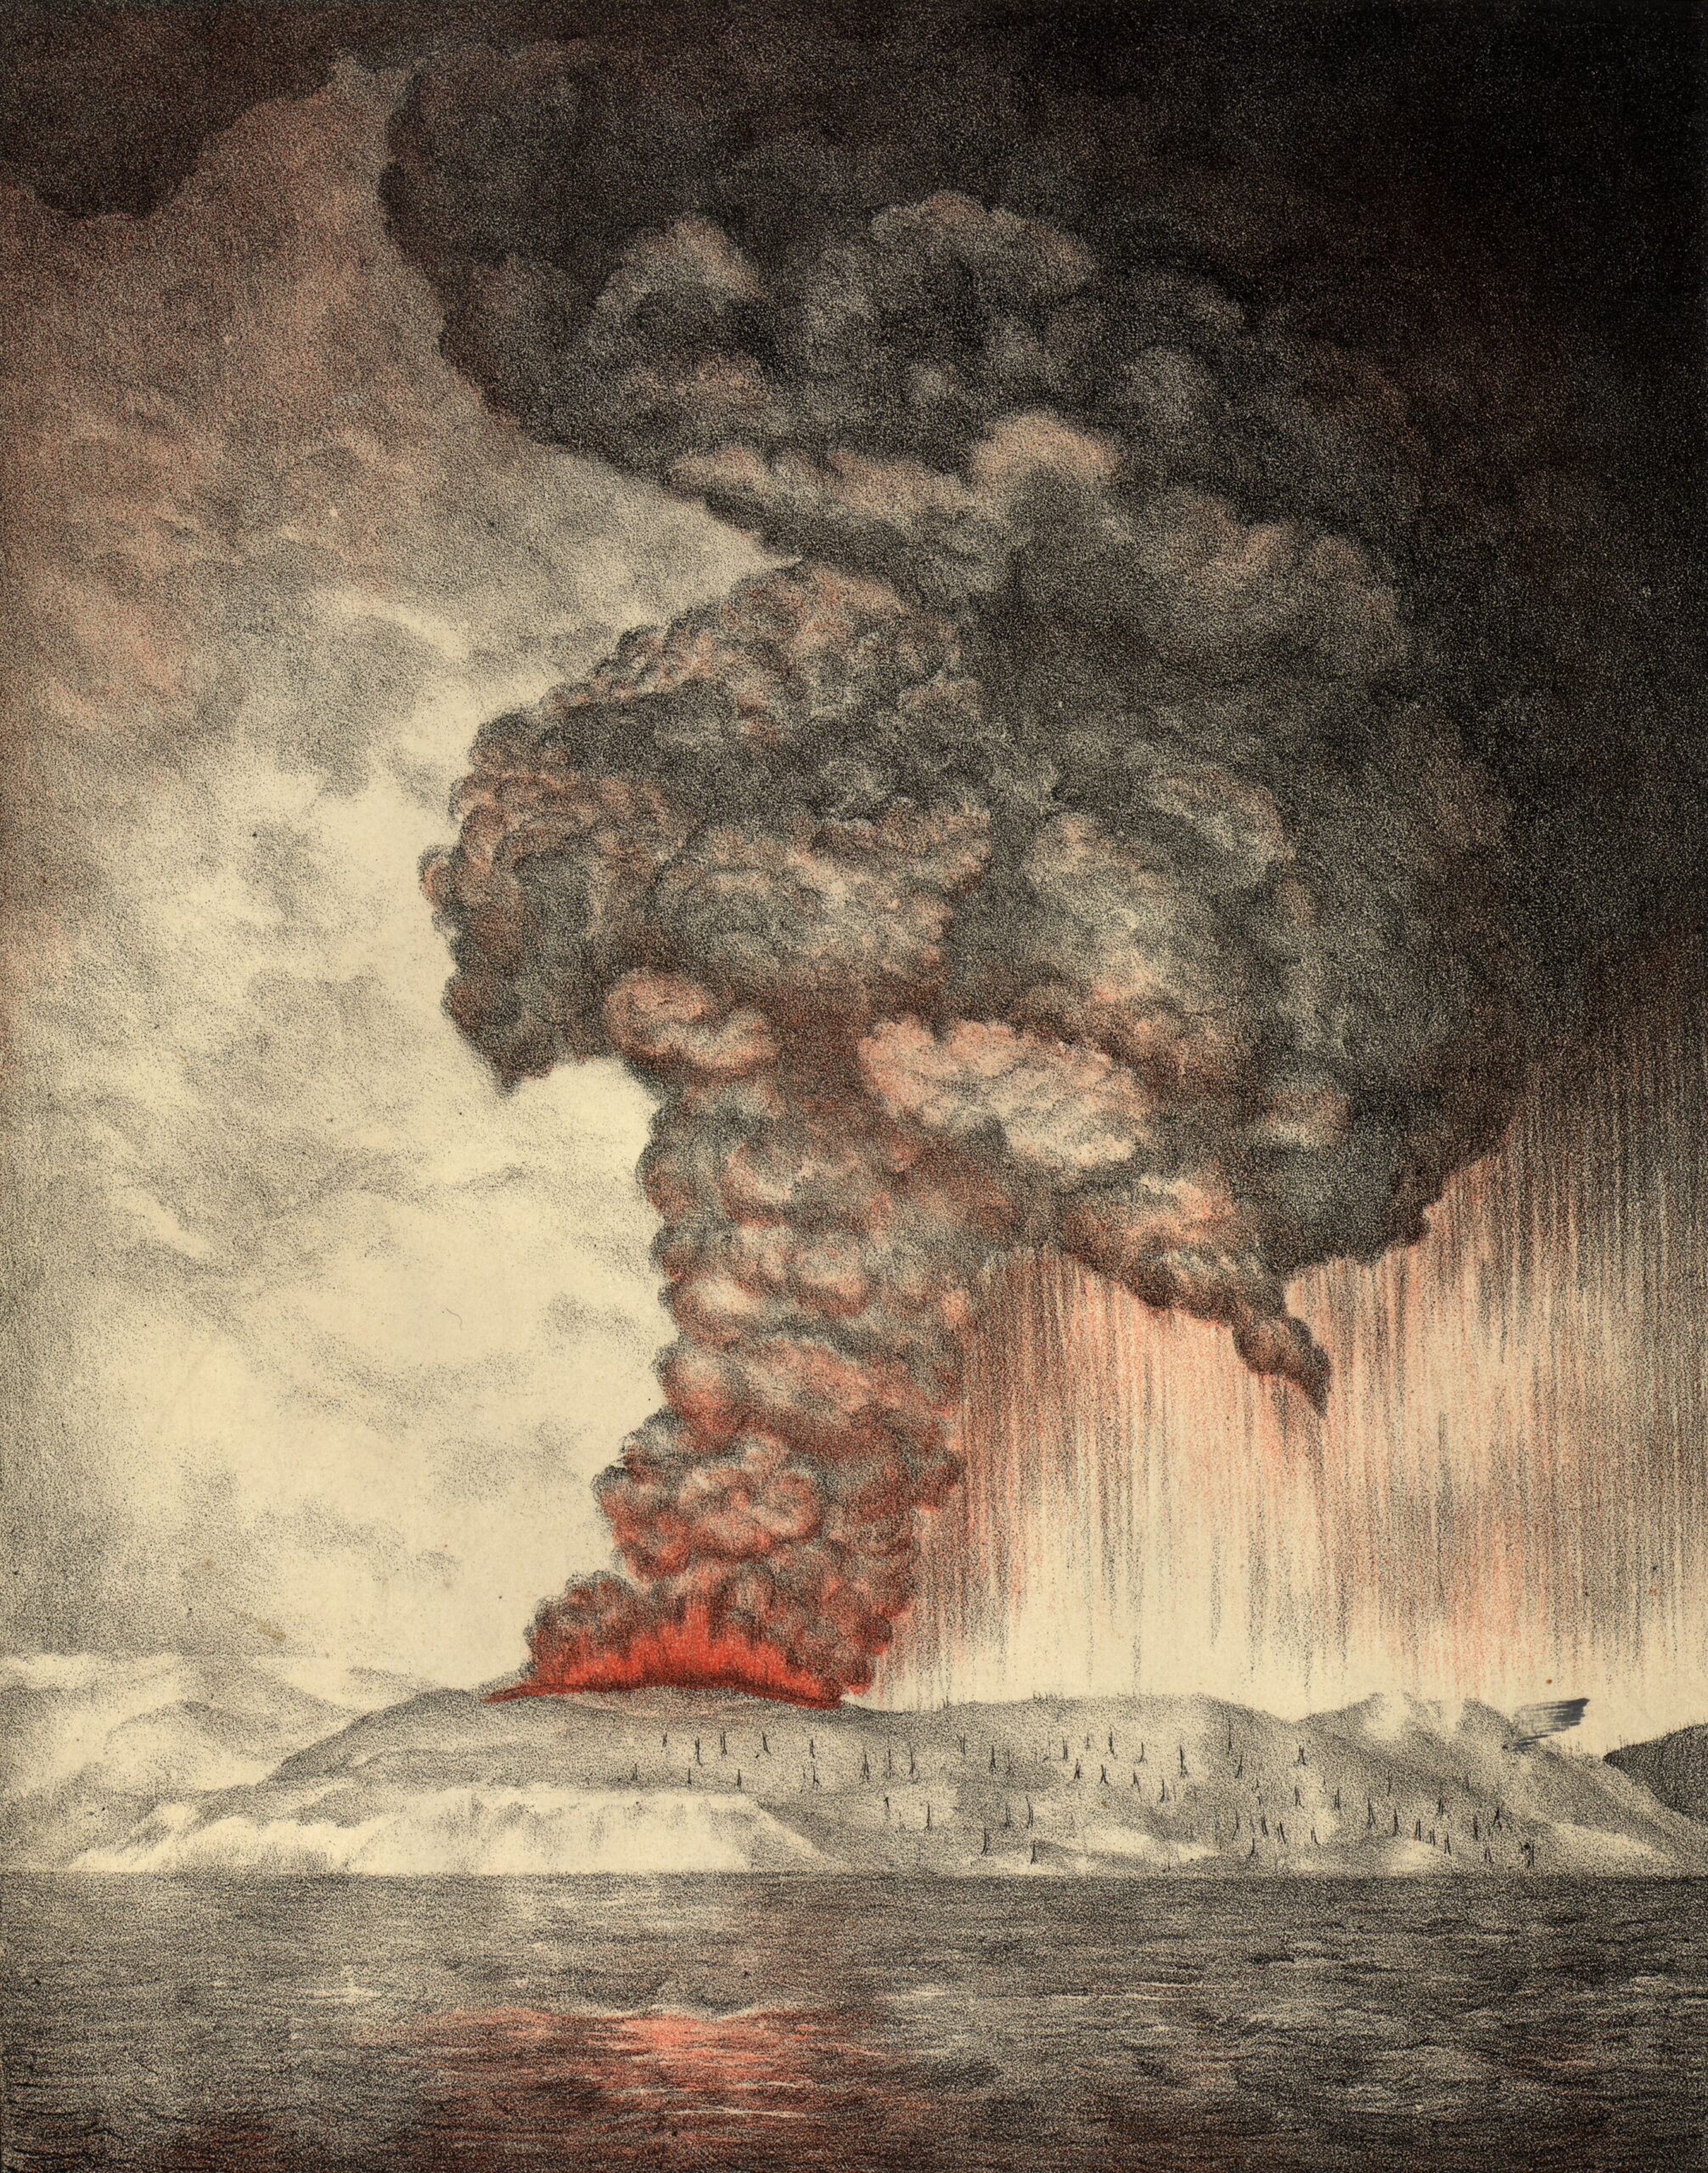
Krakatau’s climactic eruption unfolded on 26–27 August 1883. The US National Oceanic and Atmospheric Administration describes the destruction of much of the island and tsunamis that killed approximately 36,000 people in surrounding coastal communities. The eruption produced several kinds of signals: local explosions and flows, ocean waves capable of crossing sea basins, drifting ash and aerosols that altered distant skies, and a pressure disturbance moving through the air. These are related consequences of the same volcanic crisis, not interchangeable waves. A tsunami travels through water; an atmospheric pressure wave travels through a compressible gas. Neither should be imagined as the other merely continuing on a different surface. The distinction matters because modern retellings often begin with the astonishing global echo and turn the human disaster into a preface. That reverses the scale of consequence. For coastal residents, the lethal inundation was the story. For scientists reconstructing what happened, the pressure wave was an extraordinary surviving measurement. The same eruption must be understood at both scales without allowing the instrument record to eclipse the people whose homes and lives were destroyed.
What the barographs actually recorded
In June 1884, the journal Nature described M. Rykatcheff’s analysis of barograph traces from 31 observatories, including Pavlovsk, Greenwich, Kew and Toronto. Observers could compare when a distinctive pressure pulse reached different stations. They could then compare later passages of that pulse. This was a primitive form of global event reconstruction: no satellite image, no computer model, and no radio network instantly synchronising all readings. The pattern was nevertheless too orderly to dismiss as coincidence. An ordinary weather system does not announce itself at distant stations in a sequence consistent with a wave circling a sphere. The article reported estimated circumnavigation times of about 36 hours 38 minutes in one direction and 35 hours 54 minutes in the other, calculated from the timing of repeat passages. Those are estimates drawn from the historical observational network, not stopwatch readings of a single particle of air travelling around Earth. Crucially, scientists were not measuring a parcel of volcanic gas arriving in Europe. They were measuring a change in pressure passing through the local air already present there.
Seven passages are not seven complete journeys
One of the most repeated claims about Krakatau is that its shock wave went around the world seven times. It is memorable, but imprecise. A 2022 review in Bulletin of Volcanology describes four passages along the shorter route from Krakatau to an observing location and three along the longer route via the antipodal side: seven recorded passages, equivalent in the usual account to roughly three and a half global circuits. The geometry is subtle. On a globe, an outward-spreading wavefront can reach a station by more than one route. After convergence and continued propagation, further pulses may appear. A barograph can therefore register multiple arrivals without a single identifiable crest completing seven independent full laps. This is not a pedantic correction; it changes what the evidence proves. It shows a wave surviving long enough for repeated planet-spanning propagation, while reminding us that the popular phrase compresses a much richer geometry. If you draw two routes between points on a sphere—one shorter, one going the other way—the observational pattern becomes less magical and more impressive. It is precisely because the record has an intelligible physical structure that it can be trusted.
Why the air did not simply absorb the signal
At close range, an explosive eruption can generate violent, complex pressure changes. Farther away, much of the high-frequency energy is attenuated. What survives over enormous distances is a broad, low-frequency atmospheric disturbance. Researchers describe the global Krakatau signal in terms of acoustic-gravity waves and, more specifically, the surface-guided Lamb wave. Its propagation is shaped by the atmosphere’s compressibility, gravity, vertical temperature structure and the Earth’s surface. The 2022 volcanology review reports typical far-field speeds around 300–325 metres per second and dominant long-range periods around 100–200 minutes. Those figures are about the travelling disturbance, not the speed of ash or a continuous wind. Imagine pushing one end of a very long, springy system: the compression moves onward although the individual pieces oscillate locally. The analogy is incomplete—our atmosphere is layered, rotating and unevenly heated—but it corrects the instinct to picture volcanic air physically travelling all the way around the world. The signal was an organised fluctuation in the atmosphere, not a globe-circling shipment of matter.
A nineteenth-century global experiment nobody planned
The eruption accidentally tested the planet’s atmosphere on a scale no laboratory could reproduce. Barometers existed before Krakatau, and international meteorological exchange was developing, but the explosion provided a recognisable pulse that could be matched across stations. That let scientists infer propagation speeds and compare theoretical ideas about atmospheric waves. The historical Royal Society investigation and contemporary Nature correspondence are therefore more than antique curiosities: they show how an observation becomes a scientific result. First, observers preserve their raw traces. Next, they establish which marks may represent the same event. Then they compare arrival times against the geography of the stations. Finally, they test whether the proposed mechanism can explain repeated arrivals and travel speeds. There are uncertainties at every step: instrument calibration, clock accuracy, background weather and the complicated eruption sequence. Yet agreement across many independent observatories makes the interpretation stronger than any one dramatic reading. A single squiggle could be a malfunction; a coordinated pattern across continents is evidence of a shared cause.
The sky changed too—but by another mechanism
Krakatau also helped produce remarkable sunsets and atmospheric optical effects far from Indonesia. Fine material lofted high into the atmosphere interacted with sunlight, and contemporary observers recorded unusual colours. A 2024 research highlight in Nature discussed a study of the green glows reported after the eruption and their relationship to particle properties. This is a separate mechanism from the pressure pulse. One effect concerns light scattered by airborne particles that may persist and spread; the other concerns a travelling fluctuation in pressure. Their different timescales are part of the fascination. A barograph could register a passage of the wave and then return toward its previous level, while altered skies could persist for weeks or months. Treating both as a single ‘blast travelling around the planet’ would obscure the actual physics. In science, the most surprising historical event often becomes more interesting when its consequences are carefully separated rather than piled together for dramatic effect.
The modern comparison: Tonga and the instruments Krakatau lacked
The eruption of Hunga Tonga–Hunga Ha’apai in January 2022 reminded scientists how far-reaching an atmospheric disturbance can be. Modern pressure sensors, satellites and other instruments allowed researchers to follow atmospheric waves with a resolution unavailable to the nineteenth-century observers. The comparison does not mean the two eruptions were identical in size, composition or hazard. It highlights a change in what can be observed. Krakatau left scattered paper traces, human testimony and later scientific compilations; modern events leave densely sampled digital records. Yet the underlying logic remains recognisable: identify the disturbance, distinguish it from ordinary weather, follow its passage and infer the mechanism. The 2022 volcanology review explicitly places Krakatau in the long history of volcano acoustics and seismology. This historical continuity matters because dramatic new technology can make earlier science seem naive. The Krakatau observers did not have today’s instruments, but their core method—cross-checking independent measurements against a physical explanation—was recognisably modern.
What can and cannot be inferred from a pressure trace
A pressure record is powerful evidence for a travelling atmospheric disturbance. It is not a direct photograph of the volcanic vent, a complete measure of eruption energy, or a reliable standalone reconstruction of every tsunami. Inferring the source from far-field observations requires assumptions about atmospheric structure, propagation and the timing of explosions. Likewise, estimates of loudness or the claim that a particular sound was the ‘loudest ever’ need qualification: nineteenth-century acoustic measurements and human reports are not equivalent to modern calibrated measurements at the source. NOAA and the US Geological Survey document the eruption’s devastation; historical pressure analyses document the global atmospheric response. Each source answers a different question. The best explanation does not demand that one extraordinary number carry the entire story. It uses independent forms of evidence—geology, eyewitness reports, barographs, ocean records and later modelling—while remaining clear about what each can establish. This approach is also useful when reading sensational accounts of earthquakes, meteor impacts or mysterious booms today.
Why this old event still matters in India and beyond
The Sunda Strait is part of a region where people live, travel and trade close to active volcanoes and tsunami-prone coastlines. India has its own stakes in understanding how distant geophysical events can produce local signals and hazards: coastal monitoring, ocean-basin warning systems and atmospheric observation are all different pieces of the risk picture. A pressure pulse reaching an Indian instrument would not by itself mean a tsunami was about to arrive; the two hazards require different observations and warning models. But the Krakatau record demonstrates the value of networks whose stations may be far from the disaster itself. A scientist in a distant city can preserve evidence that later helps reconstruct an event, provided the data are trustworthy and shared. The lesson is not that every dramatic natural event must be global. It is that apparently local observations sometimes belong to a much larger physical system—and that detecting this connection requires patience rather than a viral claim.
The real wonder is in the correction
Krakatau’s pressure wave did not need to make seven full laps to be extraordinary. It left a recognisable signature on instruments across continents, returned along routes dictated by the geometry of the globe, and helped researchers understand the atmosphere as a medium capable of carrying long-range waves. Its scientific legacy is inseparable from the disaster that generated the data, but it should never be mistaken for the disaster’s only significance. Perhaps the most revealing feature of the story is the way a popular exaggeration can be replaced by a more precise and even more astonishing account. Seven observed passages, an atmosphere acting as a planetary waveguide, and nineteenth-century scientists piecing together a global event from ink on paper: the evidence is remarkable enough without asking it to say more than it does.
Related investigations: Lake Nyos and the danger of invisible volcanic gas; how global atmospheric observations exposed the ozone hole.
Sources and further reading
- NOAA NCEI, Historic Krakatau Eruption (updated 2023)
- Nature (1884), Krakatoa and the Sun-Glows
- Bulletin of Volcanology (2022), One hundred years of advances in volcano seismology and acoustics
- Simkin and Fiske (1983), Krakatau: A classic geophysical event
- US Geological Survey, Krakatau 1883
- Nature (2024), Why sunsets were a weird colour after Krakatau blew its top
- US National Park Service, Volcano Comparisons
Featured illustration credit: Royal Society Krakatoa Committee, 1888 lithograph, public domain, reproduced via Wikimedia Commons. This is a historical illustration, not a photograph or instrument recording of the eruption.
Have a question about this topic?
Join fellow Qurons on the Quron Forum to ask questions, challenge ideas, share discoveries and explore further.
Discuss on Quron Forum