In the Antarctic spring of 1984, a measuring instrument at a remote British research station recorded something that atmospheric models had not prepared scientists to expect. The protective ozone above Halley was drastically thinner than it had been in earlier decades. The instrument was not photographing a literal opening in the sky. It was comparing how strongly different wavelengths of ultraviolet light were absorbed by the column of air overhead. What it found was a chemical change on a continental scale.
That observation became one of the most consequential detective stories in environmental science. It involved measurements kept alive through decades of unglamorous fieldwork, a puzzle that ordinary global models failed to anticipate, a satellite confirmation, and a treaty whose effects can now be detected in the atmosphere. Yet the story is more surprising than the familiar claim that humanity discovered a hole and fixed it. In October 2026, Antarctica still develops a large seasonal ozone-depleted region. Recovery is real, but neither instantaneous nor a straight line.
A station that kept measuring when the answer seemed routine
British Antarctic Survey scientists Joe Farman, Brian Gardiner and Jonathan Shanklin were associated with a long record of ozone observations from Antarctica. Halley Research Station had collected atmospheric measurements since the International Geophysical Year era beginning in 1956. Its Dobson spectrophotometer exploited a useful property of ozone: it absorbs some ultraviolet wavelengths much more strongly than others. By comparing the incoming light at selected wavelengths, observers could estimate the total amount of ozone above the station.
Think of looking through two differently tinted panes at the same lamp. If one pane blocks a particular colour and the other barely does, comparing their transmitted light tells you something about the material between you and the lamp. The actual spectrophotometer is more sophisticated, and calibration and observing conditions matter, but the analogy captures the principle: ozone was inferred from measured absorption, not guessed from the appearance of the sky.
The critical clue was not a single alarming reading. The researchers compared spring measurements against the earlier record. Their paper, published in Nature in May 1985, described unusually large declines in Antarctic springtime total ozone. A later retrospective by atmospheric chemist Susan Solomon notes that by 1984 the October ozone layer above Halley was only about two-thirds as thick as it had been in earlier decades. It is important to retain that seasonal qualifier: the dramatic loss appeared during Antarctic spring, not as a uniform year-round thinning everywhere on Earth.
The team had reason to recheck the measurements. Instruments can drift; harsh field conditions can introduce errors; and scientists had expected much smaller global changes from the one-dimensional models commonly used at the time. Shanklin later recalled working through a backlog of observations and repeatedly checking the unexpected numbers. That distinction matters. An astonishing result becomes evidence only when researchers can exclude the simpler possibility that their measuring system has misled them.
Why Antarctica, and why when the Sun returned?
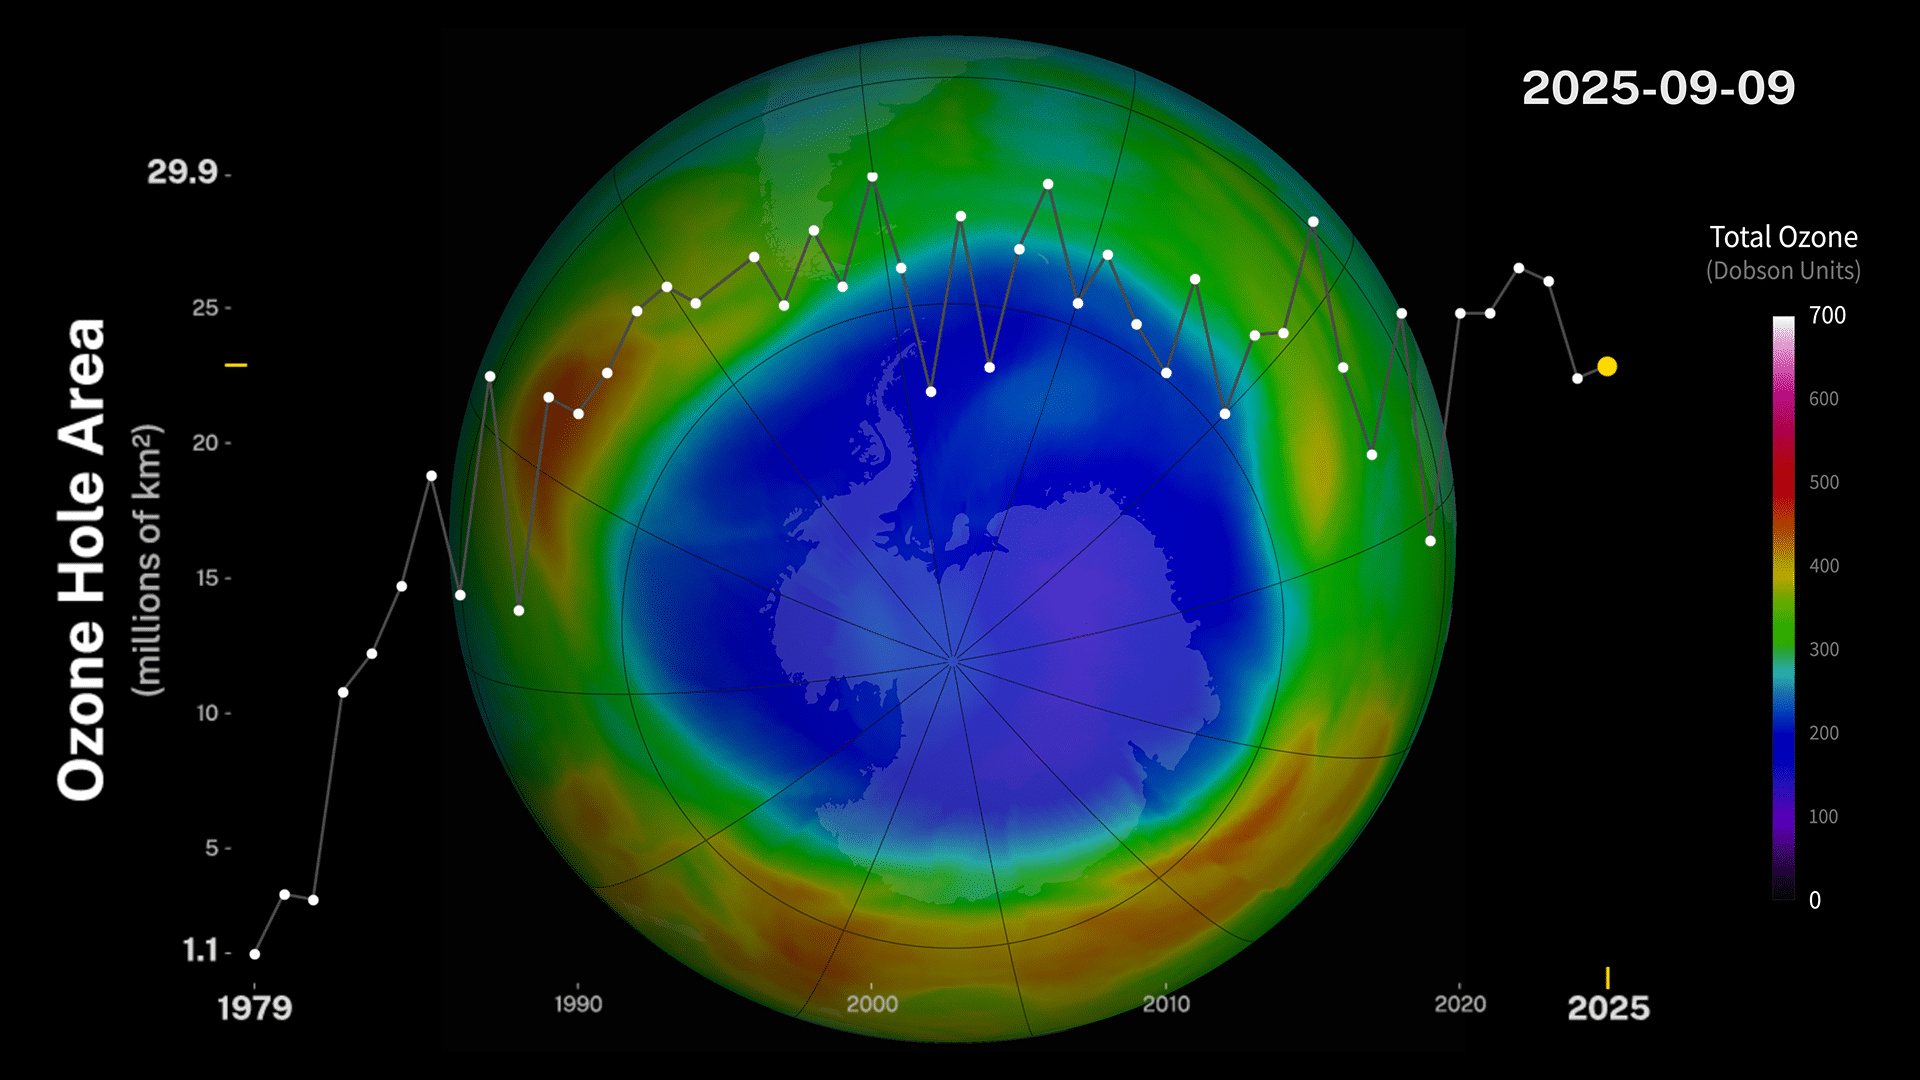
Ozone is a molecule containing three oxygen atoms, O₃. Much of the ozone that protects surface life sits in the stratosphere. It absorbs ultraviolet radiation that would otherwise increase risks to skin, eyes, plants and ecosystems. It is not the same thing as ground-level ozone, which can be an air pollutant. Nor is the Antarctic ozone hole an empty tunnel through the atmosphere. The steady ultraviolet exposure at issue here is also different from the short-lived disturbances described in QuroPedia’s explainer on solar flares; both concern the Sun, but they are not the same mechanism. Scientists generally define its mapped area as the region where the total ozone column falls below 220 Dobson units, a threshold chosen because such low values were not observed over Antarctica in the historical record before 1979.
The chemical ingredients had been accumulating quietly. Chlorofluorocarbons, or CFCs, had been valued because they were stable and useful in refrigeration, foams and aerosol applications. Stability near the ground became a liability higher up: some of these compounds survived long enough to reach the stratosphere, where energetic ultraviolet light released chlorine. Bromine-containing substances contributed too. Reactive chlorine and bromine can participate in catalytic cycles, meaning the reactive species can be regenerated and destroy many ozone molecules rather than being consumed after a single reaction.
But this alone did not explain the Antarctic timing. The polar stratosphere gets extraordinarily cold during winter. A circulation pattern known as the polar vortex helps isolate the air, and polar stratospheric clouds can form at sufficiently low temperatures. Reactions on those cloud particles convert relatively inactive chlorine reservoirs into forms capable of rapidly destroying ozone once sunlight returns in spring. The cold winter prepares the chemistry; returning sunlight helps activate the destruction. That is why a chemical threat created by products used across the world could become most dramatic above a distant frozen continent.
Here is the unexpected twist: the ozone hole did not simply reveal that the early models were numerically inaccurate. It exposed a missing kind of explanation. Chemistry occurring on cold particle surfaces, combined with polar meteorology and seasonal sunlight, could produce a sharp regional response that a simplified global average concealed. The 1985 paper suggested that unusually low temperatures made Antarctica especially sensitive to chlorine-related chemistry; later research developed the heterogeneous-chemistry explanation in detail. Science advanced by replacing an inadequate model with one that could explain the pattern and survive new tests.
From a single station to a continental map
Ground instruments provided a reliable time series, but they did not by themselves show the full geographical reach of the depletion. Satellite observations supplied that missing dimension. Research published in 1986 using instruments aboard Nimbus-7 confirmed a large Antarctic springtime decline and mapped its regional extent. The satellite work described a roughly 40% reduction in the October ozone minimum across the 1979–1985 comparison and showed that the phenomenon was far more than an oddity at one station.
It is tempting to retell the discovery as a simple story in which satellites were blind until the British scientists told them where to look. That version is too neat. The instruments were already making observations, while interpretation, validation and the presentation of an unfamiliar pattern required further work. A historical review also records unusually low ozone observations reported by Japanese researcher Shigeru Chubachi from Syowa Station before the famous 1985 Nature publication, though those earlier reports received less attention. Scientific priority and scientific understanding are not always the same event.
The crucial convergence was independent evidence: ground-based measurements, satellite mapping, and later chemical and meteorological observations pointed toward the same seasonal phenomenon. In a complex system, independent methods are more persuasive than one dramatic photograph or one statistical curve. The evidence also clarified what the hole was not: it was not a general collapse of atmospheric oxygen, nor was it a consequence of sunlight suddenly becoming more powerful. It was an alteration of a thin but essential chemical shield.
What does a Dobson unit actually measure?
The numbers can seem abstract. A Dobson unit describes the amount of ozone in a vertical column of atmosphere. If all that ozone were compressed to standard temperature and pressure, 100 Dobson units would form a layer just 1 millimetre thick. A column of 300 Dobson units therefore corresponds to about 3 millimetres of pure ozone under those standard conditions. That remarkably thin equivalent layer helps explain why relatively small changes in a trace gas can have outsized biological consequences.
In ozone-hole maps, 220 Dobson units is a convention for identifying the depleted region, not a universal biological safety switch. Exposure at any location also depends on solar angle, altitude, cloud cover, aerosols and other factors. A person in India cannot read an Antarctic ozone-hole map as a forecast of their own afternoon UV index. Nevertheless, the global significance is genuine: the atmosphere is connected, ozone-depleting substances travel, and the chemicals responsible were released by industrial systems far beyond Antarctica.
1987: an experiment no laboratory could conduct
The 1987 Montreal Protocol established a framework for controlling ozone-depleting substances, subsequently strengthened through amendments and adjustments. It did not instantly remove CFCs already released into the atmosphere, and it did not operate as a single overnight ban on every relevant chemical. Its importance lies in sustained international commitments, substitutes, measurement, reporting and progressively tighter controls. The atmosphere has long chemical memories: some ozone-depleting substances persist for decades or longer.
How can scientists tell whether policy worked when the ozone hole still appears? One approach is to measure the concentrations of the substances that cause depletion. Another is to compare observations with chemical-climate models that include the reductions in those substances, while allowing for temperature and circulation changes. The 2022 international scientific assessment found that the decline in emissions under the Montreal Protocol was contributing to ozone recovery, especially in the upper stratosphere, and that Antarctic total-column ozone was recovering despite large year-to-year fluctuations.
NASA and NOAA reported that in 2025 the Antarctic ozone hole had an average area of 18.71 million square kilometres during the core depletion season from 7 September to 13 October, making it the fifth smallest since 1992 by that particular measure. Its largest one-day extent that year was 22.86 million square kilometres on 9 September. These are different statistics: an average across weeks and a single-day maximum should not be casually interchanged. Both still describe an enormous region, not the disappearance of the problem.
In the same 2025 assessment, NASA scientists noted that weather and the strength of the polar vortex also shape each season. A relatively small hole in one year cannot be attributed entirely to chemical policy, just as a larger hole in another year does not prove the treaty has failed. The correct comparison is a long-term trend, supported by atmospheric chemistry and by counterfactual simulations, rather than a headline built around one September map.
Recovery has more than one date
Readers may encounter different predictions for when the ozone hole will be “healed.” The World Meteorological Organization and UNEP-backed 2022 scientific assessment projected a return to approximately 1980 total-column ozone values around 2040 for the near-global average, 2045 in the Arctic and 2066 over Antarctica. These are model-based estimates under specified assumptions, not appointments with nature. Different regions respond differently, and later assessments or model choices can revise the timing.
A NASA visualization released in April 2026 uses a different modelling description that mentions a return of ozone-hole size toward pre-1980 levels around 2075. That is not necessarily a contradiction with the 2066 total-column projection: the geographic area of the seasonal hole and the total-column ozone at a location are not identical recovery metrics. The safest statement is that Antarctic recovery is expected to take several more decades and remains sensitive to emissions, atmospheric dynamics and scientific assumptions.
There is also an important distinction between a treaty working and the environmental problem being finished. Old equipment, building insulation and other reservoirs can continue to release controlled chemicals. Compliance and monitoring still matter. And replacements can create separate environmental trade-offs; some hydrofluorocarbons do not deplete ozone significantly but are potent greenhouse gases, which is why the Kigali Amendment addresses their phase-down. Solving one atmospheric problem does not exempt us from examining the next one.
The lesson hiding in the original measurements
The ozone-hole discovery is often presented as a reassuring tale of international cooperation. It is that, but the more unsettling lesson comes first. The world possessed theories, models and satellites, yet a small group maintaining an inconvenient long-term record in Antarctica helped reveal that the atmosphere could behave in a way the prevailing models had underestimated. An apparently local anomaly became a test of global understanding.
It also suggests how to think about scientific uncertainty. The initial measurements did not prove every chemical mechanism; later research tested competing explanations and made the account more precise. The treaty’s benefits did not become visible on the same timetable as political decisions. And the current hole is neither proof of total failure nor evidence of complete repair. The intellectually demanding position is to hold all three truths together: the damage was real, intervention changed its trajectory, and continued observation is essential.
For readers elsewhere in the world, including India, the story reaches beyond polar geography. It connects everyday technologies, industrial chemistry, invisible atmospheric transport, field instruments, mathematical models and diplomacy. The most remarkable part is not that scientists once found a hole in the sky. It is that decades of patient measurement made an invisible planetary hazard undeniable—and gave societies a way to test whether their response was actually changing the world.
Primary evidence and further reading
- Farman, Gardiner and Shanklin, “Large losses of total ozone in Antarctica reveal seasonal ClOx/NOx interaction”, Nature, 1985 — original observational report and contemporary interpretation.
- British Antarctic Survey, 40 years since the discovery, 2025 — history of Halley measurements and the researchers’ recollections.
- Nimbus-7 satellite measurements of the springtime Antarctic ozone decrease, Nature, 1986 — independent satellite confirmation.
- WMO/NOAA, Twenty Questions and Answers About the Ozone Layer, 2022 — chemistry, polar stratospheric clouds and measurement methods.
- Scientific Assessment of Ozone Depletion: Executive Summary, 2022 — recovery projections and evidence.
- NASA/NOAA 2025 ozone-hole analysis, 2025 — recent observations and uncertainty.
- NASA Scientific Visualization Studio, Antarctic ozone-hole area 1979–2025, 2026 — updated data visualization.
Featured image: NASA Scientific Visualization Studio, Antarctic ozone-hole maximum-area visualization (1979–2025), credited to NASA; this is a scientific data visualization, not a photograph of the 1985 discovery.
Have a question about this topic?
Join fellow Qurons on the Quron Forum to ask questions, challenge ideas, share discoveries and explore further.
Discuss on Quron Forum